What is the UK national debt?
When a government spends more than it collects, it runs an annual budget deficit. This is formally known as the Public Sector Net Cash Requirement.
The accumulation of previous annual budget deficits, minus any years of surplus, constitutes the national debt.
The national debt is therefore the government’s stock of outstanding debt.
Public sector debt at the end of January 2024 as estimated at 96.5% of GDP by the Office of National Statistics, reducing from its peak in the first quarter of 2021 at 107.7% of GDP.


Based on the Conservative government’s current tax and spending plans, the Office of Budget Responsibility was estimating that the rate of debt to GDP would rise to 98.8% in 2024/25 before falling to 92.95% of GDP by 2028/2029.
This compares with an equivalent national debt to GDP of 76.9% for China, 66.4% for Germany, 92.0% for India, 111.6%% for France, 122.8%% for America, and 223.9% for Japan.
How the national debt has built up?
The Bank of England provides data on the history of the national debt.
The national debt has previously risen sharply during times of war, including the American War of Independence and the Napoleonic Wars.
The politics.co.uk chart below shows how the national debt has fluctuated over the ages.

The cost of servicing the national debt?
The first part of the Twenty First Century has seen a period of historically low interest rates. This has had a significant impact on the cost of servicing the national debt. The government’s Asset Purchase Facility (APF) scheme, relating to the practice of quantitative easing, has also reduced the net cost to the government of servicing the national debt.
According to statistics from the Office of Budget Responsibility, the total cost of government interest payments (net of APF) had previously amounted to £41.2 billion in 2011/12, the equivalent of 2.5% of GDP.
Even though the national debt had doubled in the ensuing decade, the effect of lower interest rates meant that the cost of servicing the national debt (net of APF) was expected to drop to £23.5 Billion (equivalent to 1.1% of GDP) in 2021/22.
However in the early 2020s the impact of rising interest rates has led to a considerable increase in the cost of servicing the national debt. In November 2022, the Office of Budget Responsibility (OBR) projected the UK’s expenditure on debt interest to reach £83.0 billion in 2023/24.
Based on these figures, the interest on the national debt therefore was set to equate to 5.2% of total public spending. According to the OBR, this equated to 2.5% of the UK’s GDP and was the equivalent to £1,900 per household.
Is the national debt a problem?
The subject of government borrowing is controversial both politically and economically.
While it is a truism that an economy and a government cannot sustainably spend more than it earns indefinitely, the idea that government must maintain a balanced budget each year, has been long consigned to the dustbin of UK economic history.
Controversy therefore attends to the question of whether any given level of borrowing is sustainable, and for how long. Discussions around these points invoke a range of different perspectives:
The ability to live with the national debt
Despite the national debt rising by £1.5 trillion in the period 2000 to 2020, and despite it being set to rise by a further £1 trillion as a consequence of the coronavirus pandemic, the national debt expressed as a proportion of GDP still remains lower than it did in the aftermath of the Second World War.
And although national debt as a proportion of national output in the UK is higher than in Germany, it currently remains below the equivalent figures for both France and America.
As detailed above, the current period of low interest rates, also continues to make the servicing of the national debt relatively affordable. And although inflation, would likely lead to adverse effects elsewhere in society (particularly for those on fixed incomes, and with high levels of cash), others point to how the national debt would be further eroded by future inflation.
Finally, the experience of the post war era, in which national debt decreased significantly as a proportion of GDP, is cited as evidence that high levels of national debt are not incompatible with rising living standards and high economic growth. Indeed, should the UK return to a prolonged period of economic growth, the national debt could once again start to quickly reduce as a proportion of national output.
Those who take a more pessimistic approach to the current scale of the national debt, point to worries about the impact of any upward pressure on interest rates.
The Office for Budget Responsibility has itself warned, “The increase in borrowing does, however, render the public finances more vulnerable to changes in financing conditions and other future shocks”.
The dangers of fiscal retrenchment
In discussions around the national debt, many economists warn the government away from an overly severe approach to reducing government borrowing and the associated dangers of ‘fiscal consolidation’.
It is argued that such a policy can lead to a contraction in economic activity, which in turn only leads to lower tax revenues and potentially higher public spending.
It is also pointed out that in times of economic uncertainty, there is a tendency for private sector savings levels to rise. This happened in the period between 2007 and 2012, and again during the 2020/21 coronavirus pandemic. The rise in private sector saving can lead to a slowing in consumption, and as such, government borrowing is presented as one way of maintaining overall demand.
This critique was summarized by Chick and Pettifor (2010), who wrote, “The empirical evidence runs exactly counter to conventional thinking. Fiscal consolidations have not improved the public finances. This is true of all episodes examined, except at the end of the consolidation after World War II, where action was taken to bolster private demand in parallel to public retrenchment”.
Crowding out funds for private investment
Other economists however take a different approach, and warn that high levels of government debt risk crowding out private sector investment.
When a large volume of government bonds are being issued, it is suggested that that government borrowing has the potential to compete with private sector projects, in terms of where savings are allocated.
It is suggested that this can lead to an increase in the interest rates that the private sector needs to pay in order to attract investment, and therefore it can serve to restrict investment in developing the economy’s underlying productive capacity.
A poor use of taxation revenues
Although the argument is weaker at a time of low interest rates, in the past, significant concerns have been raised around the costs of servicing the national debt, and how this money could be better spent.
This narrative came to the fore in the financial year in 2011/12.
With interest rates at a higher level than they are now, in that one year, the government spent £48.2 billion on simply servicing the national debt.
Debt interest costs, in effect, became the fourth largest government department.
In 2011/12, the sums being spent on debt repayment (£48.2 billion) were very similar to what the government was spending on schools (£51.1 billion), four times greater than what was being spent on transport, and 30% more than what was being spent on defence.
It is fair to say that when it is presented in this context, many more people become agitated about the impact of previous and consistent government borrowing.
To the extent to which responsibility for servicing current budget deficits falls on future generations, government borrowing is also presented by some people as being inter-generationally unfair.
The inability of politicians to maintain sensible levels of annual borrowing
Some people also express scepticism as to the ability of modern politicians to maintain a sufficient balance between taxation and expenditure.
The political class are said to face the dual pressure of the need to increase government spending (in a bid both to assuage public opinion and deal with the pressures of an ageing population), and to avoid electorally unpopular increases in taxation.
Against that backdrop, the need to maintain something of a more balanced government budget might always appear as a particular “can” that can be kicked down the road for a subsequent generation of politicians to confront. This would then just lead to the total debt burden continuing to rise.
The dangers of a sovereign debt crisis
The downawrd pressure on the pound in the light of Kwarsi Kwarteng’s September 2022 mini-budget, which itself substantially increased UK government borrowing, highlighted the sensitivity faced by the UK government in relation to the national debt.
Commentators had previously suggested that should the national debt continue to rise as a proportion of GDP in the medium term, then the ‘markets’ might become more reluctant to lend to the UK government in the future. This would itself lead to pressure to raise interest rates, exactly as happened in the autumn of 2022.
Where country’s fail to retain market confidence in relation to the national debt, this can lead to some kind of sovereign debt crisis. Sovereign debt crisis have the potential to have devastating effects on both social inclusion and people’s wider standards of living. After Greece suffered a sovereign debt crisis in 2009, figures from the World Bank show that GDP per head, for people in Greece, fell dramatically from $29,711 in 2009 to $18,168 in 2015.
The national debt in the twentieth century
During the First World War the national debt rose from a total of £650 million in 1914 to £7.4 billion in 1919. And once again, it increased during the decade of the Second World War, rising from £7.1 billion in 1939 to £24.7 billion in 1949.
In the immediate decades after the Second World War, there was then a sustained reduction in the national debt as a proportion of GDP.
In the 1980s, the Thatcher government followed a policy of fiscal restraint. Aided further by the privatisation of a number of previously stated owned industries, national debt almost halved from 40% of GDP in 1980 to 22% of GDP in 1990. In 1989/1990, the UK ran a budget surplus of £6 billion.
Following the recession of the early 1990s, annual government borrowing then increased markedly, peaking at £59.4 billion in 1993/4. By 1996, the National debt had risen back to 36% of GDP.
However with the economy recovering, in the last three years of the 1990s, the government once again paid back debt and ran a budget surplus, totalling £28 billion over the period. This was aided by the £22.5 billion that was raised from the sale of 3G mobile phone licences. With the economy also growing, between 1995 and 2000, UK national debt fell from 37% to 27% as a proportion of GDP.
In 1997, the new Labour chancellor Gordon Brown began his period in office with his famous ‘Golden Rule’ that the government should show a budget surplus across the lifetime of the economic cycle.
The national debt in the twenty first century
The period between 2000 and 2007
During the first seven years of the Twenty First Century, the national debt rose from 27% in 2001/2002 to 37% of GDP by 2007/2008.
Government expenditures continually exceeded government revenues. Despite the growth in the economy, the government amassed a cumulative budget deficit of some £260 billion during this seven year period.
This led people to the question extent to which the then Chancellor, Gordon Brown, was following his own publicly stated ‘Golden Rule’.
The global financial crisis
In 2008, the UK was then hit by the global financial crisis, which in turn led to a marked slowdown in the economy.
The UK experienced six consecutive quarters of negative economic growth between July 2008 and December 2009. This recession led to a drop in tax revenue and an increase in cyclical spending (for example on unemployment benefits).
Opposition politicians argued that the recession further exposed the UK’s underlying structural budget deficit – namely that the UK government was simply continuing to spend more than it was raising.
In the six years that followed the 2008 financial crisis, annual government borrowing then consistently exceeded £100 million per year. In percentage terms, the UK had the largest budget deficit of any economy in Europe other than Ireland.
During these six years the total National debt increased by £765 billion.
The national debt as a proportion of GDP more than doubled, rising from 34% before the global financial crisis in 2007/8 to reach 78% by 2013/14.
The years of austerity
Following 2010 General Election, the incoming Conservative/Liberal Democrat Coalition government embarked on a period of austerity in order to try and ‘regain control’, as they put it, of the public finances. This involved strict spending limits and a public sector pay freeze.
The extent to which this was, or was not, the right approach remains a matter of heated political debate.
In 2010, the government also established the independent Office for Budget Responsibility with the aim of improving the credibility of government economic forecasting.
By 2018/2019, the government’s annual deficit had reduced from a borrowing peak of £157 billion in 2009/2010 to £39 billion year in 2018/19.
However, although the scale of borrowing had declined significantly, the government continued to borrow money each year throughout the 2010s and the national debt continued to rise.
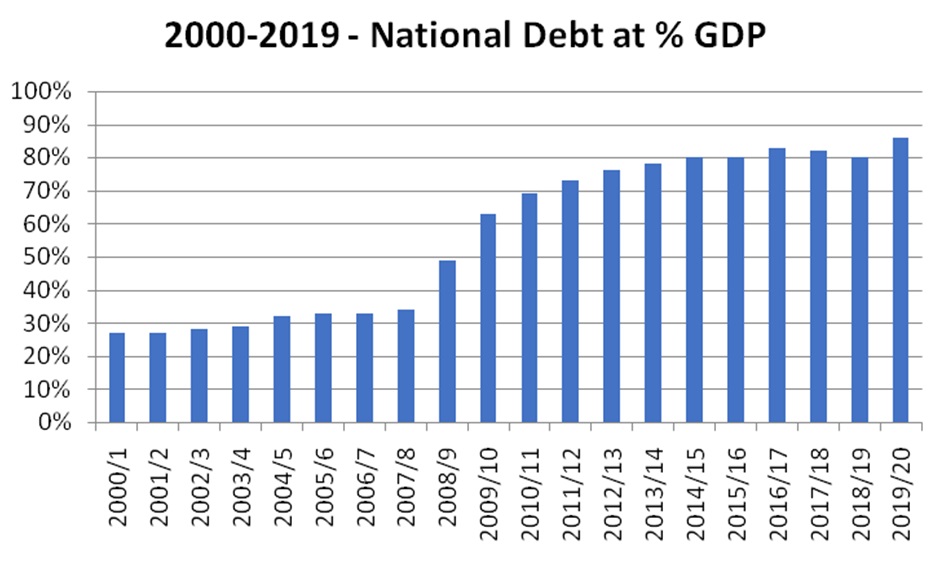
The period 2000 to 2020
Over the first 20 years of the Twenty First Century, and prior to the 2020/21 coronavirus pandemic, the UK National debt rose from £307 billion in 2000/2001 to £1.8 trillion by 2019/2020.
As per the chart below, this equated to a rise in national debt from 27% of GDP in 2000/2001, to 86% of GDP by 2019/20.
The national debt: COVID, Truss and the cost of living
In March 2020, the UK was hit by the global coronavirus pandemic.
This pandemic had a sudden, unexpected, and significant impact on the public finances.
As the economy contracted sharply, with GDP falling by an unprecedented 9.9% in 2020 alone, short term tax receipts fell considerably.
At the same time the government introduced a range of coronavirus support measures. Amongst others, these included its high profile furlough or job retention scheme whereby it covered 80% of the salaries of eligible employees; a prolonged period of business rates relief; a reduction in VAT for the hospitality sector; a stamp duty holiday; a weekly uplift in the rate of Universal credit; a £500 per person working tax credit payment; and its ‘Eat out to help out scheme’.
At the time of the March 2021 budget, the Office of Budget Responsibility estimated that the total cost of the Coronavirus support package amounted to £249.9 billion in the 2020/21 tax year. It projected that a further £93.3 billion would be spent on coronavirus support in 2021/22. Of the government’s support package, the Office of Budget Responsibility estimate that around half went to public services, 30% to households, and 20% to businesses.
Allied to a reduction in tax receipts, the government’s annual budget deficit was forecast at £320 billion in 2020/21 (15.2% of GDP), a peace time record. At 16.9% of GDP, this is a figure which was unprecedented in peace time, albeit below the 27% peak experienced in the Second World War.
However, post-pandemic problems like rising inflation have forced the government to spend more on benefits and helping people with their energy bills, as a result, national debt is yet to see a large reduction.
In September 2022, the government unveiled a 24 month energy support package which was designed to freeze average household energy bills at £2,500 per year in the face of the global rise in energy prices following the Russian invasion of Ukraine.
Three weeks later in the so called ‘mini budget’, the then Chancellor, Kwarsi Kwarteng, detailed a series of further tax cutting measures designed to support, and be paid for, by medium term economic growth.
The financial markets however quickly reacted nervously to these latest increases in government borrowing, with the Institute of Fiscal Studies suggesting there was now a newly created £60 billion hole in the public finances.
As the short term cost of government borrowing increased considerably, the new chancellor Jeremy Hunt quickly reversed his predecessors tax cuts, and signalled that a whole series of difficult decisions were also now necessary on public spending.
When Rishi Sunak became Prime Minister in October 2022, he unveiled his five priorities for government, one of which is to reduce national debt as a percentage of GDP. To achieve this, the government has called off previous tax cuts they were planning and reducing spending to help with energy bills.
The ONS predicts that government debt as a percentage of GDP will continue to fall (albeit very slightly), though it is unknown what will happen if Labour wins the next general election.
The national debt clock provides a live estimate of the current national debt.
How does the government borrow money?
The government typically borrows money from the ‘markets’. In its simplest form, some have likened this to the government operating its own savings account service.
The government issues its own bonds (commonly known as gilts). Those who buy these bonds are in effect lending the government money. At a later date, people can always sell these government bonds to others, through a secondary bond market.
Pension funds and insurance companies traditionally like the idea of investing in the government’s bonds because they consider them to be low risk. The UK government has yet to default on its debt obligations, and it is considered unlikely to do so, given that it has the ability to command money from the public through taxation. Government bonds also typically offer an in interest rate in excess of other low-risk investments, such as cash.
Historically the government required purchasers of its new bonds to settle the transaction by transferring central bank reserves into a government-owned account, thereby ensuring that government borrowing did not create additional money or induce a monetary stimulus to the economy.
However, since 2009, the government has also engaged in a practice called Quantitative Easing. Through Quantitative Easing it has been buying its own bonds back again in the secondary market. This is sometimes also referred to as the Asset Purchase Facility. The government is in effect creating new digital money to help stimulate the economy. In doing so, it also reduces the net interest rate cost of UK government debt.
One notable exception to the governmental borrowing money through gilt issues has been the Private Finance Initiative. Here the government has also borrowed directly from banks to pay for specific projects.
Who owns the national debt?
According to the Treasury’s 2019/20 Debt Management Report, as of September 2018, 32% of government gilts were owned by UK Pension and Insurance companies, 28% were owned by foreign investors, and 24% of the national debt was owned by the government itself through the Bank of England’s Asset Purchase Facility referenced above.
In 2019, private debt in the United Kingdom was recorded as being 190% of GDP, twice that of public sector debt.
Sunak defends tax hike and slams excessive borrowing as ‘immoral’
Shadow chancellor says ‘Labour will tax fairly and spend wisely’