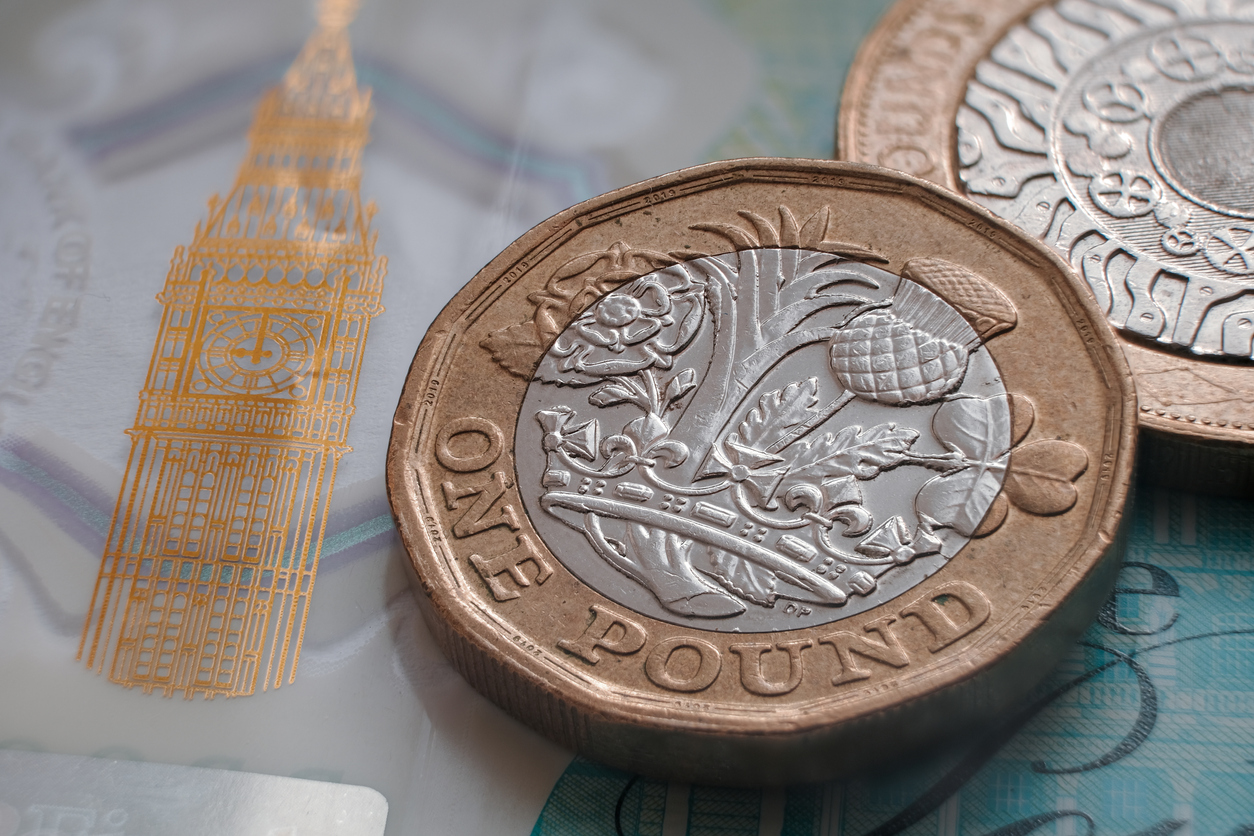
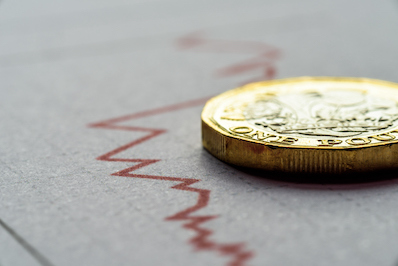
UK Inflation Rate
What is inflation?
In economic terms the word inflation is used to describe a general rise in prices across the whole economy over a sustained period.
What is the UK inflation rate?


In March 2024, the annual UK inflation rate (Consumer Price Inflation) was 3.2%. Inflation was expected to fall back within the Bank of England’s 2% target by the summer of 2024.
In October 2022, annual UK inflation reached a 30-year high of 11.1%, based on the CPI measure of consumer prices. This is now far in excess of the peak of 4.4% that was forecast in October 2021.
The previous high levels of inflation were driven by a sharp rise in energy prices from both the oil and gas sector, as well as increasing cost of food. It has also been driven by a significant increase in expenditure post the easing.
There were also concerns that Britain may enter a wage-price spiral, where increased wages to match higher prices will push up demand even further, causing even more inflation.
By May 2022, the same forces saw inflation rise to 8.5% in the United States, 7.1%, and 6.7% in Canada. Inflation was also running at 9% in Ireland.
The rate of inflation is expected to reduce to about 5% by the end of 2023 as it is considered unlikely that the prices of energy and imported goods will continue to rise as rapidly as they have done recently.
What is the problem with inflation?
Although inflation can reduce the value of debt, including government debt, there are a whole host of reasons why the political and economic class is opposed to high inflation:
Higher inflation hurts the poor
High inflation typically has a regressive effect on lower-income families and older vulnerable citizens who might be living on a fixed income. If prices are rising faster than wages, then there will be a steep decline in real incomes. Inflation tends to redistribute income and wealth towards groups who are better able to hedge against inflation by sheltering their assets in ways that earn a decent return.
Reduced attraction to save
High inflation can typically outstrip the interest rates offered by banks for people’s savings. This deters people from saving. More problematic, hyperinflation can destroy the value of the savings that many people have spent their lives building up.
Increased costs of borrowing
High inflation typically leads to a policy of higher interest rates, both as a government tool to combat inflation and as a way of financial markets seeking to protect themselves against rising prices. This can lead to a spiral in which household debt and mortgages become unaffordable to pay for many people causing many people to lose their homes.
An ongoing cycle of more inflation
High inflation can lead to an increase in pay claims as people look to protect their real incomes through high wage pressure. A rise in actual inflation can lead to an upward shift in inflation expectations, which can then become bedded in, and self-fulfiling in an economy.
Business uncertainty
High inflation is not good for business confidence as firms cannot be sure of what their costs and prices are likely to be. This uncertainty can deter investment, which can then have a knock-on impact on productivity and a country’s overall productive potential.
Loss of trust in money
Really high levels of inflation, known as hyperinflation, can destroy the actual purchasing power of money. It invalidates the role of money as a medium of exchange.

UK Inflation has been far lower between 1990 and 2020 than in the 30 years between 1960 and 1990.
What causes inflation?
The causes of inflation are a matter of debate between economists. These debates are typically most fierce in relation to the role of the money supply.
The most classical description of inflation is “too much money chasing too few goods”; in other words the demand for goods and services exceeds the economy’s ability to supply those goods and services – and when products are scarce, prices rise. This comes under the remit of what is sometimes labelled as demand-pull inflation.
There is also cost-push inflation. Companies may increase production in order to meet the increase in demand, but only by incurring increased costs which they will then need to recoup – and so when costs rise, prices rise.
Conversely, if supply outstrips demand this can lead to deflation – a general fall in the prices of goods and services – which can be just as problematical as inflation.
In order to control inflation, therefore, it is essential to maintain a steady balance between the growth in demand and the growth in supply.
How is inflation measured in the UK?
In the UK, the responsibility for controlling the annual inflation rate and ensuring price stability now falls on the central bank, the Bank of England.
There are several ways to measure inflation. In the UK the two main measurements are the Retail Price Index (RPI) and the Consumer Price Index (CPI). Although similar in approach, they differ slightly in coverage and method of calculation.
Both the RPI and the CPI measure price changes in a representative ‘basket’ of goods and services to produce a monthly overall index of prices.
This is done by collecting sample prices of hundreds of goods and services bought by UK households and measuring the average price changes in those items from month to month. According to the Office of National Statistics, approximately 180,000 prices, covering 720 goods and services, are collected each month from around 140 locations in the UK.
Items in the ‘basket’ are weighted to reflect spending patterns; those on which consumers spend the most money have a higher weighting. The goods and services included in the ‘basket’ are reviewed each year, with changes made if necessary to ensure the ‘basket’ remains representative of current spending patterns.
However, some goods and services included in the RPI measurement are not included in the CPI measurement, for example mortgage interest payments, Council Tax, TV licence and trade union subscriptions. And the CPI includes charges and fees which are not included in the RPI such as stockbroker fees, foreign student tuition fees and unit trust fees.
Also, because the CPI and the RPI are constructed using different formulae, (the RPI uses an arithmetic mean and the CPI a geometric mean), the CPI inflation figure will tend to be lower than the RPI figure.
An inflation target is set by the Government each year and announced by the Chancellor in the annual Budget statement. From June 1997 to December 2003 the inflation target was 2.5% based on the RPIX measure of inflation; this is the same as RPI except it does not include mortgage interest payments. In December 2003 the target was changed to 2% based on the CPI measure of inflation.
Through its Monetary Policy Committee, one of the Bank of England’s main objectives is to keep prices stable and inflation low, thereby ensuring a stable economy.
If inflation moves away from the target (still currently 2%) by more than one percentage point on either side (i.e. more than 3% or less than 1%) the Governor of the Bank of England must write to the Chancellor explaining in his letter: why inflation moved away from the target;the period within which the Monetary Policy Committee expects inflation to return to target; the policy action being taken to deal with it; and how this approach meets the Government’s policy objectives.
If after three months inflation remains above or below the target by more than one percentage point, the Governor must write another explanatory letter to the Chancellor. This process continues until inflation is brought back under control.
History of inflation in the UK
Early Years
History showed that a recurring cause of an imbalance between demand and supply leading to high inflation is war. This is because so much money is spent in wartime on producing arms and too little spent on other goods and services that shortages are created – and again when products are scarce, prices rise.
According to the Bank of England, the highest inflation ever recorded in Britain was at the time of the wars with France – the French Revolutionary Wars which began in 1793 and led on to the Napoleonic Wars. A similar situation was seen at the time of the First and Second World Wars.
Following the French wars, inflation was brought under control in Britain by adopting the gold standard which linked the value of paper money to the price of gold. Bank of England notes could in theory be redeemed for gold in the Bank’s vaults and the amount of money in circulation could not exceed the reserves of gold. This ensured the value of money was stabilised, which in turn led to stable prices and several years of stable inflation.
However, as had happened with the French wars, the link between gold and the pound was broken during the First World War with more and more bank notes being printed which could not be redeemed against gold. Years of deflation followed between 1921 and 1933 and despite the link being restored in 1925, this failed to halt the constant fall in prices. Britain finally left the gold standard in 1931.
Post War Period – 1945 to 1997
Inflation was stabilised again after Britain joined the Bretton Woods system in 1944, which linked the currencies of participating countries to the US dollar which was in turn linked to gold reserves.
However, the system collapsed in 1971 and Britain once again faced problems of rising prices and high inflation. In 1973, inflation reached over 23% per year. High inflation at this point has been attributed to a growth in credit and consumer spending, a sudden spike in energy prices (which saw global oil prices rise 70%), and rising wages in part due to the industrial relation climate at the time.
Upon her election in 1979, the new Prime Minister Margaret Thatcher made it one of her primary tasks to reduce inflation. Where inflation had reached 14.7% in 1980, by the 1987s inflation in the UK had reduced to 3.5%.
There was then a period of higher inflation rose again in the late 1980s, surpassing 8% in 1990. During the rest of the 1990s, inflation dropped back down to 2.4% in 1996. In 1992 the then chancellor, Norman Lamont, announced that the Government had decided to introduce a specific inflation target as part of a new monetary policy framework.
The Independence of the Bank of England – 1997 to date
Shortly after Labour returned to power in 1997 the new chancellor, Gordon Brown, made the Bank of England independent of political control. The Monetary Policy Committee became responsible for setting interest rates at a level which would ensure the Government’s inflation target was met.
A period of stable inflation then followed, until the global financial crisis contributed to fluctuating CPI inflation rates between 2008 and 2011 reaching a record high of 5.2% in September 2008. CPI inflation remained at over 4% in early 2011.
However, inflation began to fall towards the end of 2011 and by May 2012 was once again within the target. For much of the years 2010 to 2019, the UK inflation rate was in the range between 1% and 2.5%.
Following the easing of lockdowns emanating from the Covid 19 pandemic, inflation started to rise again across many developed economies. In the UK, inflation rose to 3.1% in September 2021, and the Office of Budget Responsibility forecasted that it would average 4% through 2022. In the light of a dramatic rise in energy prices, following the Russian invasion of Ukraine inflation soon rocketed to 11.1% in the UK, the highest levels for over four decades.
Following rising interest rates and an easing in energy prices, inflation is now set to return to its early Twenty First Century trend of being below 2%.
Statistics
In 1923, Germany experienced one of the most famous episodes of hyperinflation. In December 1923 wholesale prices were over 85,000,000,000% higher than a year earlier. The highest denomination bank notes had a face value of over 1000,000,000,000 marks. By October more than 99% of bank notes had been in circulation for less than 30 days.
In 1946, Hungary experienced the highest inflation ever recorded. In the peak month of July 1946 prices were doubling in little more than 12 hours. The largest denomination bank note in circulation was worth 100,000,000,000,000,000,000 pengo. – Source: Bank of England