Ever since the 2019 general election, the concept of the Red Wall in the north has become a regular part of the UK’s political discourse. As the Conservatives hoovered up Brexit party voters to win a number of seats which had been held by Labour since the Second World War and beyond, the 2021 local election results in the north of England, and the Hartlepool by-election, have only entrenched this concept.
However, the north of England’s Red Wall is not the only part of the electoral landscape which has been undergoing demographic changes in recent years. A similar realignment seems to be occurring in the south of England, in what has been dubbed the Blue Wall.
The Blue Wall has previously been described by Steve Akehurst as containing 41 seats held by the Conservatives since 2010 with a majority below 10,000, and where either Labour or the Liberal Democrats outperformed their national swing against the Conservatives in both 2017 and 2019.
However, to observe what the recent 2021 election results mean for the Conservatives in the south of England, the ensuing analysis considers the wider range of 82 Conservative seats within Gloucestershire, Wiltshire, Oxfordshire, Hampshire, Surrey, West Sussex, East Sussex, Kent, Hertfordshire and Cambridgeshire.


For this analysis I have used division/ward level results from the recent 2021 elections to infer notional results in the constituencies in these counties and to analyse vote shares. This provides an insight into the current state of affairs in the Blue Wall in 2021.
The results of this analysis makes for interesting reading.
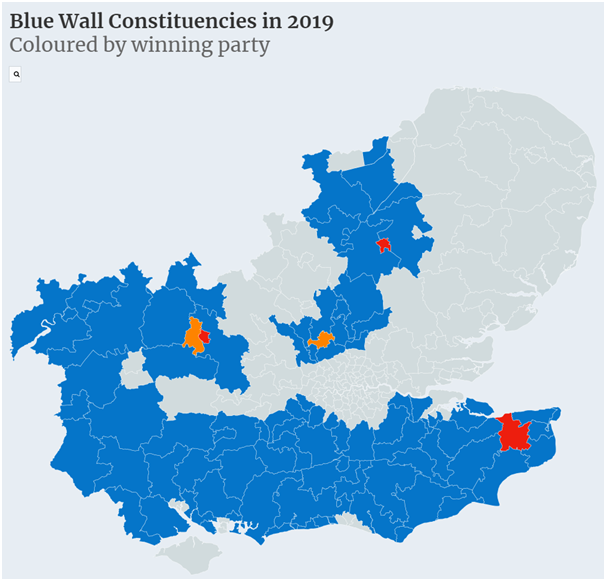
The Blue Wall in the 2019 General Election was nearly complete.
The Conservatives gained 82 of these seats in 2019 but the notional 2021 results now suggest that they would lose 6 overall. Labour would lose Canterbury to the Conservatives, but the Lib Dems would gain 7 seats from the Conservatives (Winchester, Eastleigh, Eastbourne, Chippenham, Cheltenham, Watford, and South Cambridgeshire).
In terms of the specific vote share in the region under consideration, the Conservatives would obtain 48.6% (down 7%), Labour would obtain 17.6% (down 2.4%), the Lib Dems would obtain 24.1% (up 4.2%) and the Greens would obtain 9.7% (up 6.5%).

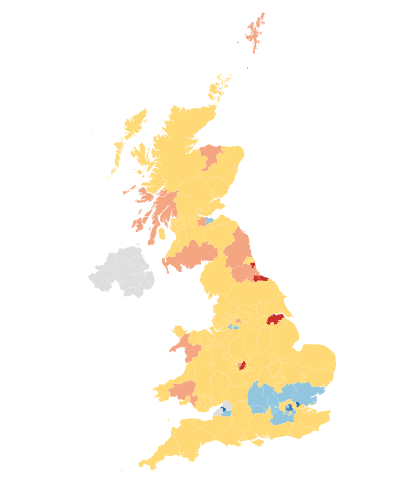
The 2021 results show chinks appearing in the Blue Wall.
An analysis of this kind always comes with a caveat. These results are based on local elections and so are not necessarily indicative of the full levels of support in each constituency. In addition, for areas like Oxfordshire where pacts existed between parties (the Lib Dems and Greens in this case) some of the vote shares will be somewhat distorted as those parties will not have stood in every division. Finally, in a couple of areas, some parties are simply stronger at local government level than they ever are likely to be at Westminster level, even if it would be wrong to exclude them from the analysis.
Nonetheless, this analysis does illuminate the trends in each area.
These results paint an interesting picture as to how the Blue Wall is slowly but surely starting to trend away from the Conservatives. Away from the national picture and media headlines that focus on the Conservatives gaining 235 councillors and holding a 7% lead in the national vote share, according to the BBC, in the south of England the Conservatives would be on course to lose 6 constituencies.
This picture also bodes better for the Liberal Democrats who, despite polling single digits in the national polls (potentially down even from the 12% that they received in 2019), would now make gains compared to their 2019 general election performance.
In the near future, the Chesham and Amersham by-election will be a key barometer of this trend in the Blue Wall. Britain Elects recently projected notional results for this constituency which showed the Conservatives on 43.6%,the Lib Dems on 22.9%, the Greens on 17% and Labour on 10.5%. Should the Lib Dems succeed in cutting that notional majority significantly, that would provide a further key indicator of growing Lib Dem strength in the south of England.
If this continues in the longer term, the trend being seen in the Blue Wall could eventually spell trouble for Boris Johnson as he maintains his very public focus on the Red Wall. At the very least, losses in the Blue Wall will soon reach the point whereby they outweigh any gains that can be made in the Red Wall. And should Labour start to reverse its loss of support in the Red Wall, the position becomes far more dangerous for the Conservatives.
Of course, while the Blue Wall region is trending away from the Conservatives, on the basis of the 2021 local elections, the transformation is minor compared to that seen in the Red Wall in recent years. It seems unlikely that, if an election was held tomorrow, the Conservatives would suddenly find themselves without a majority as the Blue Wall suddenly crumbled before them.
For now the Conservatives are safe; they have a sufficiently strong hold on both the Blue Wall and Red Wall, and thanks to the successful vaccine roll out they maintain a solid lead in the polls.
However, the fact that they continue to lose ground in the Blue Wall provides a potential indication of where this trend is heading. Eventually the vaccine boost will fade away, the economic costs of Covid will come to bear, and Labour and the Lib Dems will recover.
At that point the Blue Wall has the potential to cause a serious headache for the Conservatives.