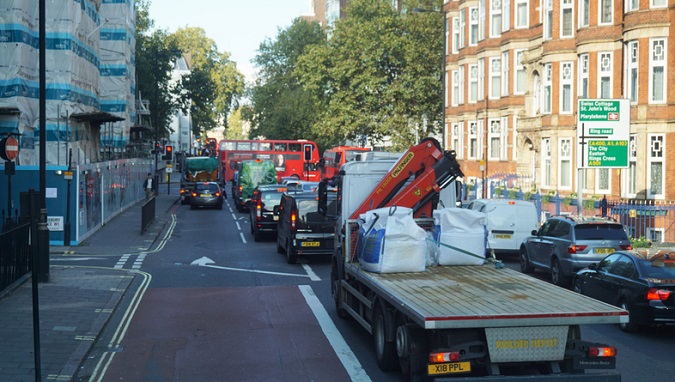
What are bus lanes?
Bus lanes are stretches of road in which only busses – or vehicles carrying more than eight passengers – are permitted to travel during operational hours.
The world’s first bus lane came into force in Chicago in 1940. Some thirty years later, the UK welcomed its first bus lane on Vauxhall Bridge in London, 1968.
Identifying bus lanes
Bus lanes are marked out by dashed and solid white lines signifying their beginning and end point. There may also be select areas where vehicle crossing is permitted; for instance, to access a loading bay or turn-off. The words ‘bus lane’ are painted on the road for further clarification.
Fines for using a bus lane can be as high as £160 in London.
Bus lanes are only observed during set times which often correspond to peak traffic hours. Outside these hours, the lanes function as normal roads. The timeframe and days relevant to each lane are signalled by blue road signs at the lane’s entrance. If no time is given on the bus lane sign, it has to be presumed that the bus lane is always in operation.


Blue signs and road markings also indicate which (if any) other vehicles are allowed to use the lanes. Vehicles such as licensed taxis, motorcycles, scooters and bicycles may be granted access if indicated by the sign.
Bus lane enforcement and penalties
Entering an operational bus lane is occasionally justified on the grounds of public safety; the most common examples being to avoid obstructions or clear the path for emergency vehicles. When this is the case, car drivers are required to leave the bus lane as soon as possible.
Excluding these select circumstances, crossing a bus line typically incurs a penalty charge of between £30 and £65 for an alleged contravention, with fines reaching £160 in Greater London. A penalty charge notice (PCN) will be sent to the vehicle’s registered owner with details of the infringement.
Enforcement is monitored by CCTV cameras which record any instances of unauthorised entry. Fines may be appealed if considered unfounded. Less than 1% of charges are said to be appealed, suggesting that the majority of penalty-holders simply accept their violation.
Following consistent increases in bus-lane fines, RAC spokesperson Rod Dennis urged local councils to review their bus lanes and ensure signage is clear.
The case for bus lanes
The primary case for the creation of dedicated bus lanes on the UK road system is built around the greater appeal which it brings to bus travel. The lanes are thought to deliver faster journeys and more reliable departure times corresponding to timetables.
It is argued that measures that enhance the attraction and effectiveness of public transport, will lead to its increased use, and reduce the number of cars on the road. The associated reduction in exhaust emissions will then improve air quality, and reduce pollution which contributes to global warming.
On a social level, improvements to bus routes better facilitate travel for vulnerable members of society and those without personal transport. Bus lanes have also been said to create safer spaces for cyclists when they are authorised to use them.
By contrast, it is argued that when busses run the risk of being stuck in traffic, the result is slow journey times and a failure to run to schedule. In turn this leads to unsatisfied passengers, higher operating costs and general declines in service use.
Despite these objectives, in written evidence provided to the House of Commons Transport Select Committee, the Transport Research Laboratory suggested bus lanes have brought only minimal improvements to journey times or reliability. It was reported that improvements of just 1-2 minutes have been observed between scheduled and actual departure times of busses.
Opposition to bus lanes
The introduction of bus lanes has been said to fuel resentment from certain portions of the motoring community.
Limiting stretches of road to specific vehicles decreases the total road space that was previously available. This results in increased wait times for car drivers, and potentially higher emission rates due to the increased congestion that results. As such, it is argued by some, that the extra traffic jam generated by a bus lane, is likely to contribute to an overall increase in emissions.
The initial construction of the bus lanes can also cause significant disruption, incurring costs which campaigners argue outweigh their financial gain.
The efficacy and viability of bus lanes is said to be dependent on varying factors in the town or city concerned. These include the level of public demand for bus travel in the area, the nature of the existing infrastructure, and the exact location in which the lanes are sited. In particular, priority lanes situated too close to junctions have been proven to be counter-productive, due to increased queues of non-priority traffic ahead of the junction.
Quotes
Mayor of London, Sadiq Khan, in response to decreased public transport use during the Coronavirus Pandemic: “What we can’t afford to have is a car-led recovery. What we don’t want is one health crisis being turned into another health crisis: bad air quality.”
Statistics
In London, fifty miles of bus lanes are enforced on a 24/7 basis.§ Buses have been proven to carry more commuters than all other forms of public transport combined and help to generate £64bn per year for local economies. [Source – Stagecoach Group]
888,760 penalty charges were sent to drivers infringing bus lane regulations throughout the UK in 2017. This is a rate of almost 2,500 a day and generated over £41 million a year in fines. [Source – RAC]
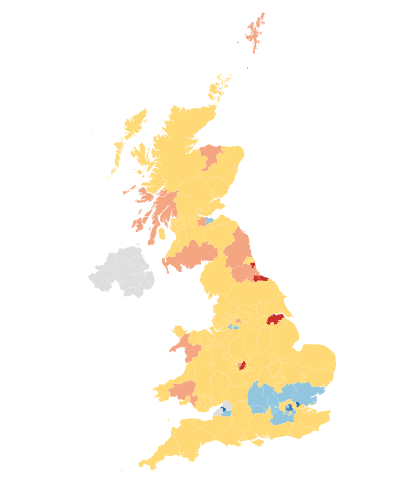
In 2018, Aberdeen and Glasgow handout out more bus-lane fines than anywhere else in the UK. Between them, these two cities issued 145, 408 charges, which equates to 16% of the UK total. [Source – RAC]
An average of 953 trips using different modes of transport were recorded in 2019. Of these, 855 trips were made using private transport, and 50 by bus. [Source – Gov.uk]
In 2019/20, a predicted 4.5 billion local bus journeys were made in Great Britain. This constitutes 57% of all public transport journeys. [Source – Gov.uk]