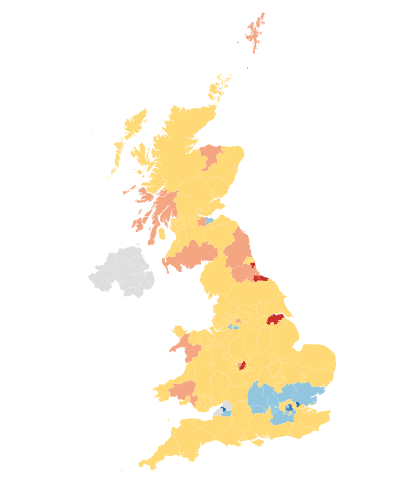
Politics.co.uk has visualised the way in which planning permission requests vary across the country by local authority.
Find out more about planning permission requests in your local area, and how this compares to the rest of the UK. Click here or use the tool below:
Map produced using the interactive constituency mapping tool, PoliMapper.
Data released by the Department of Levelling Up, Housing and Communities and the Ministry of Housing, Communities and Local Government in March 2022 has highlighted the impact of location on planning applications.


Over an eight year period (2014-2021), the City of London consistently places within the top three easiest places to get planning permission approved, with a 98.7% average approval rate. The Borough of Copeland (96.4%), Isles of Scilly (95.6%), Richmondshire (95.5%) and Wigan (95.4), all closely follow as the local authorities where planning permission requests are most likely to be approved.
On the other hand, Molden came out on top as the most difficult place to get planning, with 40.4% of requests being denied. East Hertfordshire, Hillingdon, Enfield and Harrow also listed highly, with nearly 40% of all applications being denied in these locations.