London’s population has shifted east over the last decade, with Tower Hamlets recording the highest population increase in the country, whilst the borough of Kensington and Chelsea has seen their population decrease by over 10%.
This is one of the key findings of the first batch of Census data, which was released at the end of last month. Working with Polimapper, we have created four interactive maps to visualise the changes in the population of England and Wales.
To learn more about how your area has changed in the last ten years, click here or use the tool below.
Carried out every ten years, the UK census is a national survey which helps build a detailed snapshot of society.


The census covers the following topics:
- Demography and migration
- Ethnic group, national identity, language and religion
- Health, disability, and unpaid care
- Housing
- Labour market and travel to work
- Sexual orientation and gender identity
- Education
- UK armed forces veterans
This first release included the rounded population and household estimates for England and Wales, at the local authority level, cross tabulated by sex and age.
With Polimapper, we have created four interactive maps to visualise the first data sets; Overall Population, Number of Households, Population Density, and Usual Residents by Five Year Age Ranges. Using the 2011 census results as a point of comparison, we have calculated the percentage change to help show the shifts in society in the last ten years.
There has been much change in London since 2011. Areas such as Kensington and Chelsea and Westminster have seen significant decreases in their populations, with the former seeing a 14.32% drop in its male population in ten years. The population density and number of households has, in turn, also seen decreases.
On the other hand, Tower Hamlets has seen the greatest increase in overall population in England and Wales, at 22.12%.
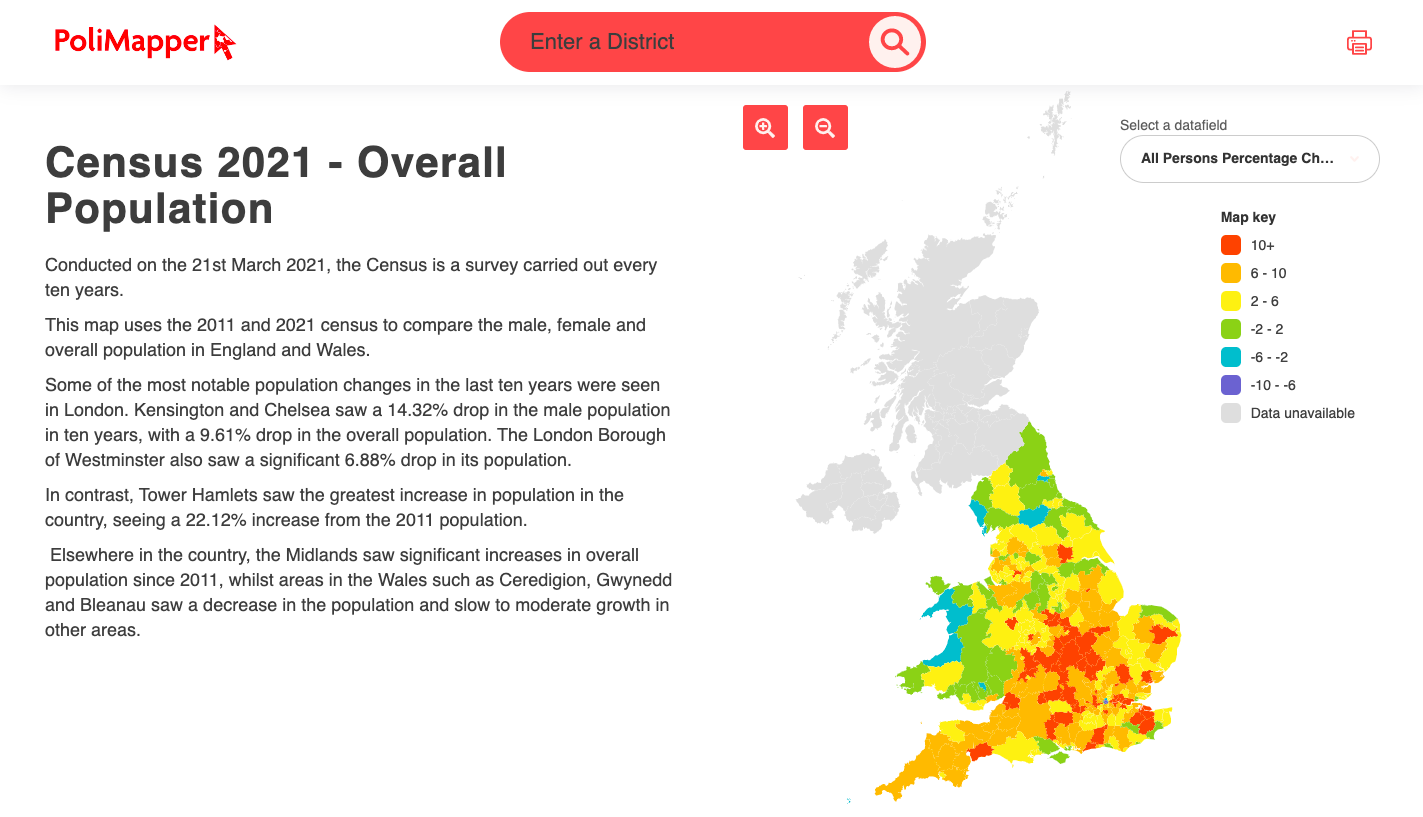
In other parts of the country, Wales and the North mostly saw a decrease, or only a small increase in its overall population since 2011, whereas the Midlands and South West has seen a strong growth in their populations.
Across England and Wales, the female population increased by 6.42% and the male population by 5.66%, with an overall population increase of 6.04%.
The average number of households with at least one resident has increased from 70,592 to 74,874, whilst the average number of usual residents per square kilometre has increased by just under 100 people, from 1,614 to 1,713.
The maps also highlight the ageing population of England and Wales. Since 2011 there has been a 7.21% decrease in the number of 0-4 year olds, whilst the number of 70-74 year olds has increased by 37.74%.
Redditch saw a 74.14% increase in the number of 70-74 year olds, whilst Westminster recorded the greatest decrease in the number of under 5s, at -32.63%.
The number of people living to over 90 has increased across England and Wales by 23.19%.
To find out more about the census, visit https://www.polimapper.co.uk/census-2021